The costs of underperforming cells

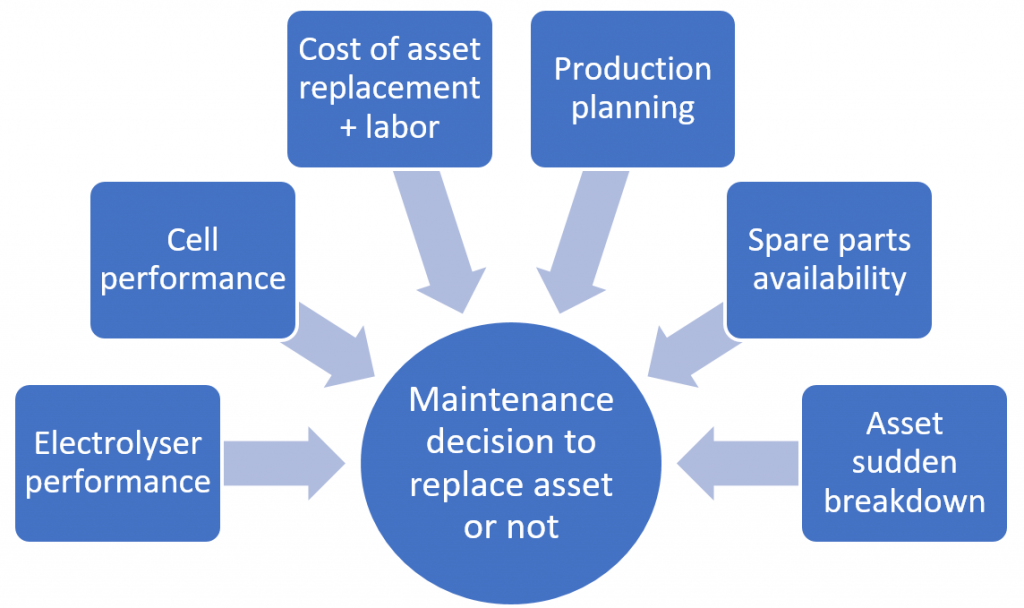
In the chlor-alkali industry, the decision to replace which ion exchange membranes or electrodes, and when, is a complex decision that can be driven by many factors: electrolyser performance, production planning (e.g., required production to fulfill customer orders or other on-site downstream processes), availability of spare parts, cell performance, membrane/electrode replacement cost, etc (Figure 1, right). While factors such as electrolyzer performance or production planning are usually well understood to make maintenance decisions, this blog focuses on an often-overlooked factor: individual cell performance.
Changes in the Chlor-Alkali Industry
While during the last 40 years the chlor-alkali electrolyzer and cell design changed a lot, the maintenance strategy in most plants did not. Among other factors, current densities have increased sharply, an electrolyzer can contain today 200 cells compared to 40 cells 40 years ago, production volumes per electrolyzer have risen from 4000 tons of caustic soda per year 40 years ago to 40 000 tons of caustic soda per year nowadays, zero-gap cells are now common in newer electrolyzers while that technology didn’t exist a few decades ago, etc. But despite all those important changes, maintenance is still usually triggered by average electrolyzer voltage and electrolyzer current efficiency, and all cells are replaced at the same time. We will see below why this strategy is not optimal in today’s context.

Cell Performance Variation

At the high level, cell performance is often assessed using two criteria:
- Normalized cell voltage
- Cell current efficiency
Normalized cell voltage is a useful metric, because cell voltage increases over time and because premature cell aging can often be deduced from high cell voltage. Cell voltage can vary widely from one cell to the other: about 400 mV between the best and worst cells in Figure 3, which amounts to a production cost difference of about US$ 3000/year*. This voltage variation between cells is due to each cell’s unique properties: slight differences in electrode coating thickness, position in electrolyzer, etc.
Similarly, cell current efficiency, that is the ratio in percentage of the cell actual production over the theoretical production, is also used to assess cell performance. Individual cell current efficiency exhibits wide variations, as seen for example in figure 4 where it ranges between 93% and 98% from the worst cell to the best cell. This 5% difference reduces the annual production by 10 tons of NaOH for a single cell in a constant power scenario, which corresponds to about US$ 4000/year**. This example is typical of many electrolyzers that R2 has seen over the years. It means that underperforming cells, where the additional production costs per year are higher than the maintenance costs, are left in operation. This situation opens the door to significant improvements in terms of energy savings and higher production volumes.

How to Detect Cell Underperformers
Now that the variability of cell performance is established, the question becomes: how can underperforming cells with high voltage and low current efficiency be identified? While determining cell voltage is easy with a safety system or a voltage monitoring system, measuring cell current efficiency is much more difficult.
Furthermore, which components (electrodes, membranes, etc.) within that cell require replacement? At first sight, it does not make sense to replace all the anodes/cathodes/membranes if only the membranes, for instance, are causing the subpar performance.
To find out the answers to these questions, read the white paper “What is the best maintenance strategy for membranes and electrode coatings in chlor-alkali?”.

