
Process Data Analysis at Your Fingertips
Analyze
Whether you want to dig into a recent electrolyzer abnormal behavior, ascertain if similar events exhibited similar data patterns or trend cell voltages, Visual Extractor offers you the capabilities to analyze your plant data with an intuitive icon-based navigation. The time range for the analysis is entirely customizable, and the resulting data is displayed in a clear graph.
Comparing data between different cells or electrolyzers for the same period can uncover interesting insights to better understand plant behaviour. Visual Extractor allows you to stack as many graphs as desired, each graph containing one or more tags.
Replay
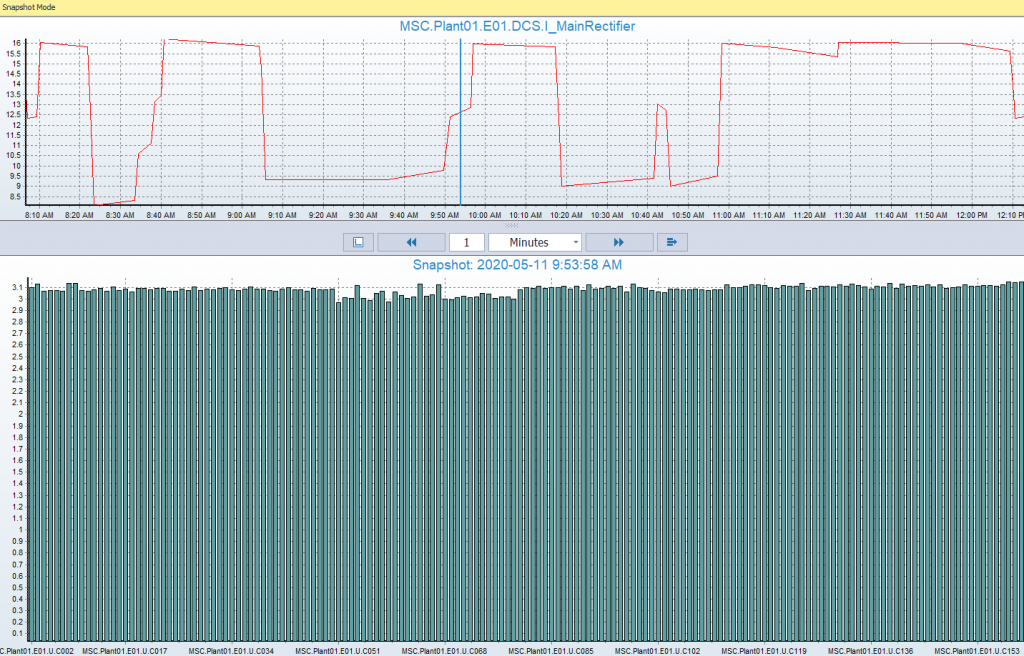
You can also replay real-time values for specific time ranges, allowing you to investigate past events or near misses. The replay functionality also enables you to observe how changes in process values over time affect other related values (graph on right).
Export
Visual Extractor enables you to export your data to a csv format (e.g., Excel) or to another R2 database for further analysis with an easy-to-use Wizard. You can also create scripts to schedule re-occurring data exports.
Key Features and Benefits
benefits
features
Perform In Depth Analysis of Process Data
Drag and Drop Historical Trending
Export Plant Data to Excel or Another R2 Database
Easy-to-Use Data Export Wizard
Replay Past Events or Near Misses in Real-Time
Bar Chart Replay Function (Snapshot Mode)
Compare Data Between Cells or Electrolyzers
Stackable/Synchronized Graphs for Multiple Tags
Documentation
The EMOS® Visual Extractor allows you to analyze process value trends, replay significant operational time periods (e.g. startups, shutdowns), and export your data.